
In April 2019 we upgraded our trace element reporting to include cumulative results for routine screening. This year our outstanding team of programmers have gone an extra step, and we are now able to report cumulative results for a farm PLUS local regional trends for a specific trace element.
Cumulative reporting can be used to identify seasonal trends within the same year or previous years specific to that farm. This enables veterinarians to quickly track results for specific farms without having to find previous trace element reports and advise on strategic supplementation. It also provides a more user friendly, visual reference for farmers that can be used to track changes over time and align supplementation with management decisions.
We have now added regional trending to the reports so that farmers and veterinarians can see where the farm sits in relation to other farms within their region.
This new graph feature can be used with farmers as a tool to highlight the importance of regular trace element testing, by showing that deficiencies / toxicities are being seen in their area.
Trace element reports will now include:
· Individual numerical test results for the current case
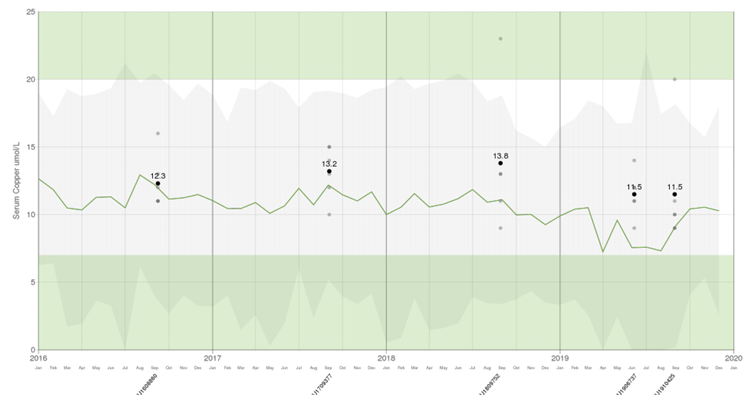
· Graphs showing cumulative results from the last five years for the property (if available).
· Mean local regional trends are now also displayed on the graphs as a green line with grey shading representing the range of variation within that region (approximately 95% of results, or 2 standard deviations). See Figure 1.
Regional data is dependent on accurate identification of the species, age and location, so please supply as many details as possible on submissions so you and your farming clients can make the most of this exciting innovation.